
Visualise your application’s performance in real-time
The PVRTune suite allows you to profile applications on PowerVR hardware to an unprecedented level of detail. Visualise your application’s performance in real-time with a wide array of counters and metrics, and save the session to perform low-level analysis and detect performance bottlenecks.
PVRTune is composed of three parts: the desktop GUI client, a hardware-based server, and a performance analysis library. Each can be used to get to the heart of the matter in your debugging and profiling to figure out how to improve your performance.

PVRTune GUI
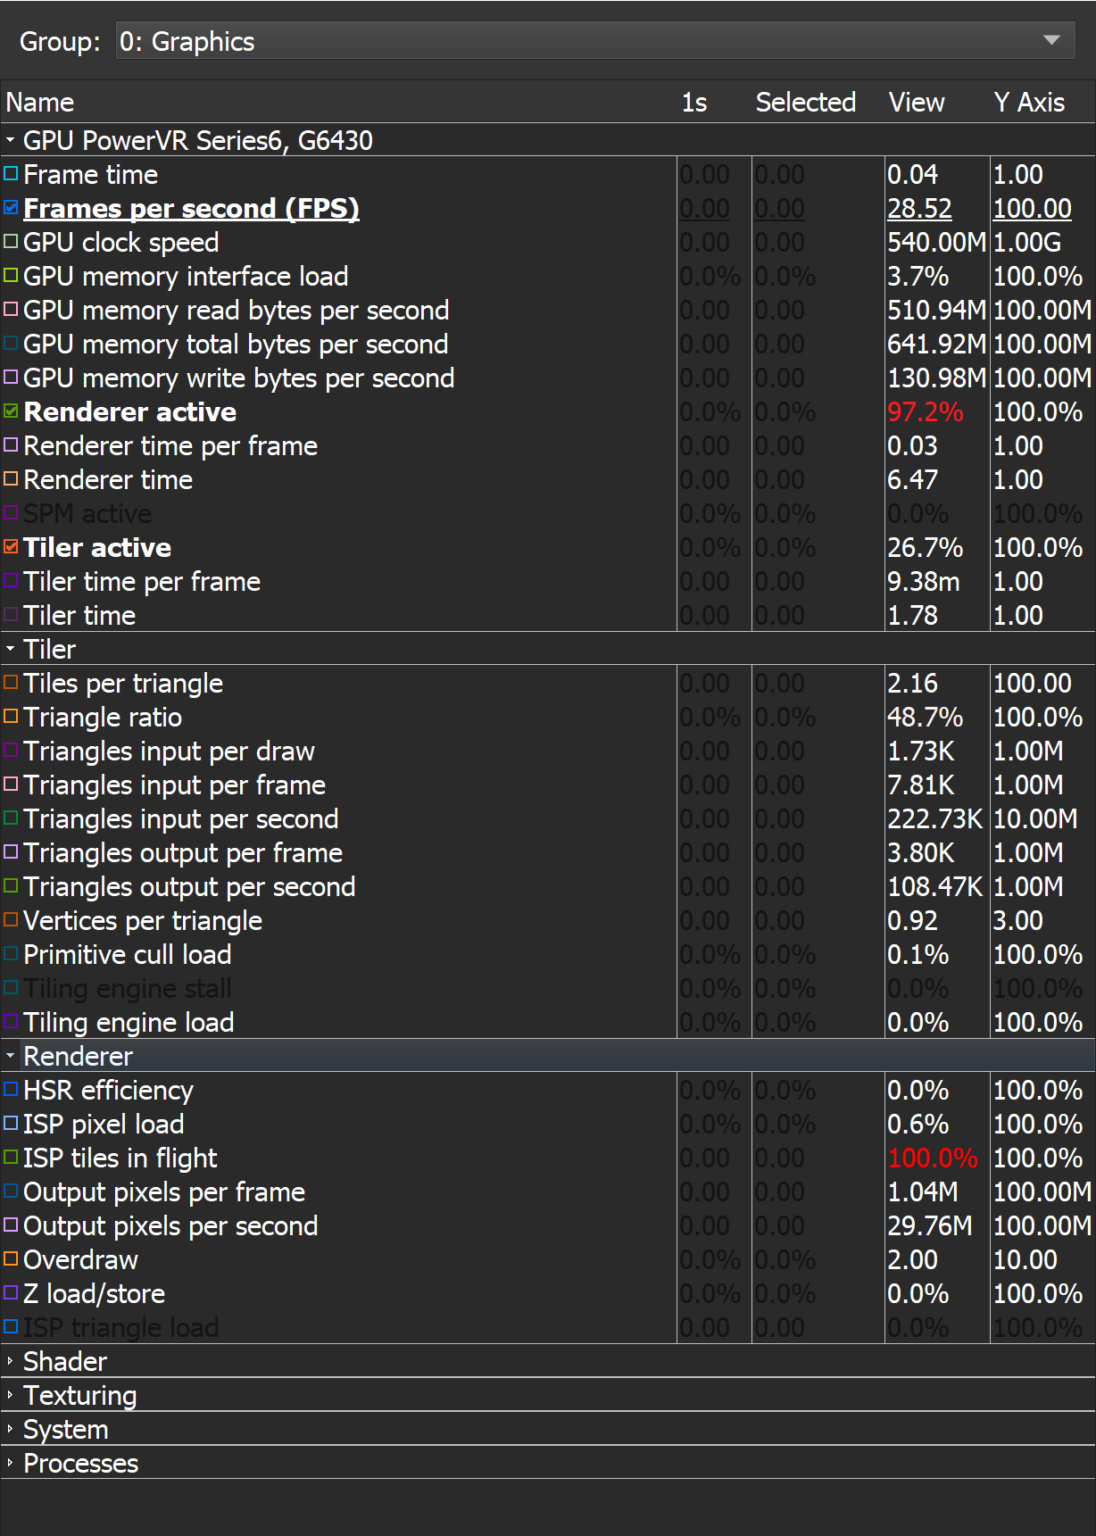
The GUI can show incoming data in real-time on a visual graph, or save and open recordings for offline analysis, allowing for full flexibility in your development process.
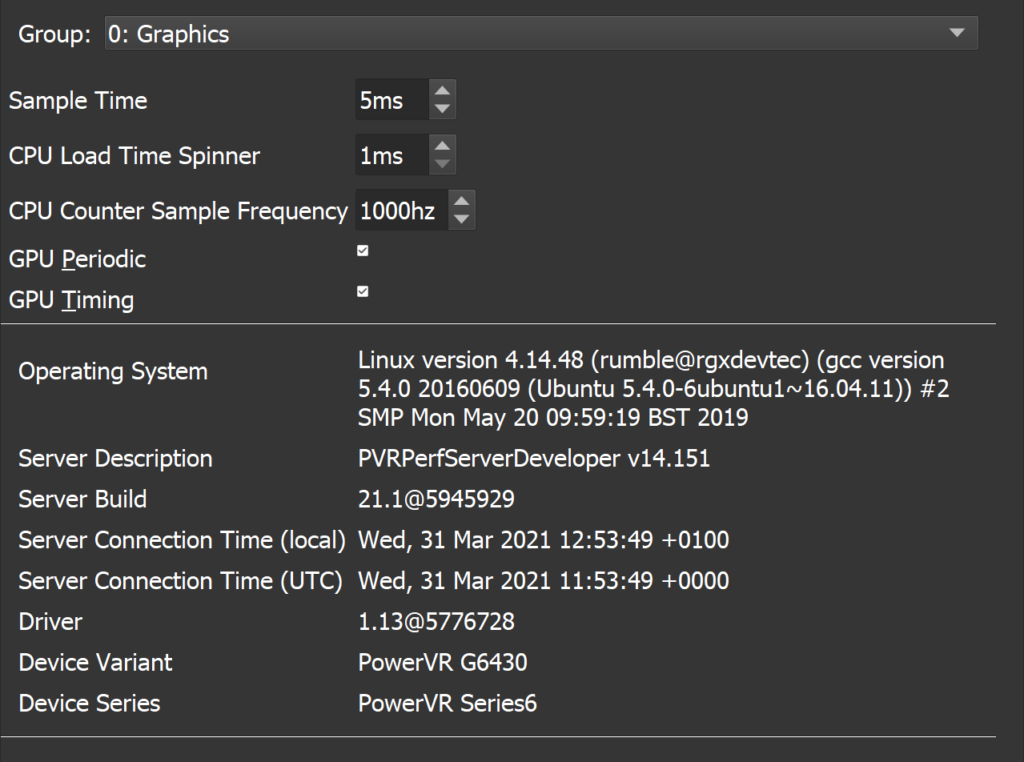
The GUI also allows you to control the remote deployment of PVRPerfServer, configuring exactly what statistics are collected and how they are presented; all in a simple format with clear, visual output, meaning you can get right into identifying bottlenecks and analysing the fine-grained performance information.
PVRPerfServer
It connects to the PowerVR graphics driver and is able to read, monitor, and collect data emitted by the driver and forward it on for user analysis. This server application can be started manually on the target device as a standalone CLI as well, allowing you to configure performance data and saving recordings to an external file for profiling later.
PVRPerfServer can also be remotely deployed by the desktop client over a network for easy use.
PVRScope
It enables applications to link to and retrieve GPU counter data from PVRPerfServer, or it allows your application to send data to PVRTune for combined visualisation with hardware information. PVRScope makes it easy to visualise specific behaviours within your application to the PVRTune GUI.
By enabling direct access to PowerVR hardware counters, you’ll have the freedom to manipulate hardware counter data for your own, in-flight analysis while your application runs, allowing you to profile different variations of your application without needing to recompile each time.
Examples on how to use PVRScope are also included within our PowerVR SDK.
PVRTune Complete
PVRTune Complete improves the profiling experience by exposing even more low-level data, giving you even deeper insights into your application’s performance.
This includes client data stream information, such as events emitted by OpenGL ES, OpenCL, EGL, and Vulkan driver modules, additional hardware counters and the ability to define custom counters, as well as easily detecting pipeline bubbles and firmware bottlenecks with synchronisation data and firmware timing data, respectively.
Get started with PVRTune
Unlock the potential of PVRStudio by downloading our powerful tool below!
Harness the capabilities by referring to our comprehensive documentation at the top of the page for a smooth start.
You must log in to access our downloads.